The ToxPanel Method
ToxPanel is a tool to
calculate gene-set scores based on fold-change (FC) values relative
to randomly selected sets of genes. We provide two different gene
sets: our own gene sets indicative of liver and kidney injuries
[1-4] and Kyoto Encyclopedia of Genes and Genomes (KEGG) pathways
[5]. However, users can customize their own gene sets or, for
example, use gene sets from the Molecular Signatures Database
(MSigDB) [6].
AFC—Aggregated Fold Change Activation
Detailed descriptions and performance characteristics of the AFC
method can be found in the original literature [7, 8]. In this
method, the gene-set or KEGG pathway score is defined as the sum of
the log-transformed FC values of all genes in the set or pathway. We
then use the pathway scores to perform null hypothesis tests and
estimate the significance of each pathway by its p-value, defined as
the probability that the pathway score for a random data set is
greater than the score from the actual data. The z-score is the
number of standard deviations by which the actual gene-set value
differs from the mean of randomly selected FC values (10,000 times).
The sign of the gene-set score represents the direction of
regulation: the pathway is considered up-regulated (overexpressed
genes) if the net sum of the gene-expression levels after treatment
is increased relative to control and down-regulated (suppressed
genes) if decreased.
AAFC—Aggregated Absolute Fold Change Activation
The AAFC method calculates the activation score of a gene set [2].
This method identifies gene sets (e.g., modules) that are
significantly changed or disrupted without considering the direction
of change. The method, which takes the absolute values of the
log-transformed FC values, performs well in identifying
significantly altered pathways [7]. Its drawback is the lack of
information about the direction of change in a pathway (whether it
is up- or down-regulated, i.e., if the sum of the activation scores
of genes in a pathway increases or decreases relative to control).
The AAFC method first reads a list of gene FC values uploaded by the
user and calculates the absolute value of the log-transformed FC
value for each gene. For each gene set (i.e., module or pathway), it
then sums all of the absolute values to calculate the total absolute
FC value. Subsequently, we use the gene-set scores to perform null
hypothesis tests and estimate the significance of each gene set by
its p-value, defined as the probability that the score for randomly
selected FC values (10,000 times) is greater than the score from the
actual gene set. A small p-value implies that the gene set value is
significant. The z-score is the number of standard deviations by
which the actual gene set value differs from the mean of the
randomly selected FC values. In the AAFC method, we are only
interested in positive z-score values, as negative z-score values
indicate FC values smaller than the absolute average FC value.
Aggregated p-Value: Fisher’s probability test
We have provided an option to include a significance value (i.e., p,
q, or false discovery rate) associated with each log-transformed FC
value in the input file. These values can be used to calculate a
combined p-value for each gene set (module), using Fisher’s
probability test as an indicator of robustness of the reliability of
the gene set [9].
Fisher’s method combines the p-values from k independent tests into
the test statistic
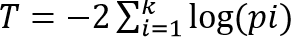 , which has
a χ2 distribution with 2k degrees of freedom. Fisher’s
combined p-value is then 1-ϕ(T), where ϕ is the cumulative
distribution function of the χ2 distribution.
, which has
a χ2 distribution with 2k degrees of freedom. Fisher’s
combined p-value is then 1-ϕ(T), where ϕ is the cumulative
distribution function of the χ2 distribution.
References
- J.A. Te, M.D.M. AbdulHameed, A. Wallqvist, Systems toxicology of chemically induced liver and kidney injuries: histopathology‐associated gene co‐expression modules, J. Appl. Toxicol. 36 (2016) 1137-1149.
- P. Schyman, R.L. Printz, S.K. Estes, K.L. Boyd, M. Shiota, A. Wallqvist, Identification of the toxicity pathways associated with thioacetamide-induced injuries in rat liver and kidney, Front. Pharmacol. 9 (2018) 1272.
- P. Schyman, R.L. Printz, S.K. Estes, T.P. O’Brien, M. Shiota, A. Wallqvist, Assessing chemical-induced liver injury in vivo from in vitro gene expression data in the rat: the case of thioacetamide toxicity, Front. Genet. 10 (2019) 1233.
- P. Schyman, R.L. Printz, S.K. Estes, T.P. O'Brien, M. Shiota, A. Wallqvist, Concordance between thioacetamide-induced liver injury in rat and human in vitro gene expression data, Under Review.
- M. Kanehisa, S. Goto, KEGG: Kyoto encyclopedia of genes and genomes, Nucleic Acids Res. 28 (2000) 27-30.
- A. Liberzon, A. Subramanian, R. Pinchback, H. Thorvaldsdóttir, P. Tamayo, J.P. Mesirov, Molecular signatures database (MSigDB) 3.0, Bioinformatics 27 (2011) 1739-1740.
- M. Ackermann, K. Strimmer, A general modular framework for gene set enrichment analysis, BMC Bioinformatics 10 (2009) 47.
- C. Yu, H.J. Woo, X. Yu, T. Oyama, A. Wallqvist, J. Reifman, A strategy for evaluating pathway analysis methods, BMC Bioinformatics 18 (2017) 453.
- R.A. Fisher, Statistical methods for research workers, 4th ed., Oliver and Boyd, London, 1932.